3. Unleash the accounting power with pacct
Did you know that you can log the completion of every single process running on your machine? You may even want to do this, for security, statistical purposes, load optimization, or any other administrative reason you may think of. By default, process accounting (pacct) may not be activated on your machine. You might have to start it:
/usr/sbin/accton /var/account/pacct
Once this is done, every single process will be logged. You can find the logs under/var/account. The log itself is in binary form, so you will have to use a dumping utility to convert it to human-readable form. To this end, you use the dump-acct utility.
dump-acct pacct
The output may be very long, depending on the activity on your machine and whether you rotate the logs, which you should, since the accounting logs can inflate very quickly.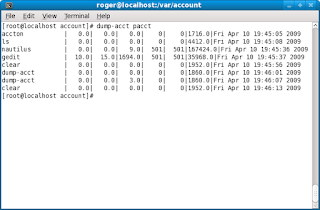
And there you go, the list of all processes ran on our host since the moment we activated the accounting. The output is printed in nice columns and includes the following, from left to right: process name, user time, system time, effective time, UID, GID, memory, and date. Other ways of starting accounting may be in the following forms:
/etc/init.d/psacct start
Or:
/etc/init.d/acct start
In fact, starting accounting using the init script is the preferred way of doing things. However, you should note that accounting is not a service in the typical form. The init script does not look for a running process - it merely checks for the lock file under /var. Therefore, if you turn the accounting on/off using the accton command, the init scripts won't be aware of this and may report false results.
BTW, turning accounting off with accton is done just like that:
/usr/sbin/accton
When no file is specified, the accounting is turned off. When the command is run against a file, as we've demonstrated earlier, the accounting process is started. You should be careful when activating/deactivating the accounting and stick to one method of management, either via the accton command or using the init scripts.
4. Dump utmp and wtmp logs
Like pacct, you can also dump the contents of the utmp and wtmp files. Both these files provide login records for the host. This information may be critical, especially if applications rely on the proper output of these files to function.
Being able to analyze the records gives you the power to examine your systems in and out. Furthermore, it may help you diagnose problems with logins, for example, via VNC or ssh, non-console and console login attempts, and more.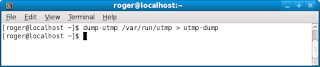
You can dump the logs using the dump-utmp utility. There is no dump-wtmp utility; the former works for both.
You can also do the following:
dump-utmp /var/log/wtmp
Here's what the sample file looks like:
5. Monitor CPU and disk usage with iostat
Would you like to know how your hard disks behave? Or how well does your CPU churn?iostat is a utility that reports statistics for CPU and I/O devices on your system. It can help you identify bottlenecks and mis-tuned kernel parameters, allowing you to boost the performance of your machine.
On some systems, the utility will be installed by default. Ubuntu 9.04, for example, requires that you install sysstat package, which, by the way, contains several more goodies that we will soon review:
Then, we can start monitoring the performance. I will not go into details what each little bit of displayed information means, but I will focus on one item: the first output reported by the utility is the average statistics since the last reboot.
Here's a sample run of iostat:
iostat -x 10 10
The utility runs 10 times, every 10 seconds, reporting extended (-x) statistics. Here's what the sample output to terminal looks like:
6. Monitor memory usage with vmstat
vmstat does the similar job, except it works with the virtual memory statistics. For Windows users, please note the term virtual does not refer to the pagefile, i.e. swap. It refers to the logical abstraction of memory in kernel, which is then translated into physical addresses.
vmstat reports information about processes, memory, paging, block IO, traps, and CPU activity. Again, it is very handy for detecting problems with system performance. Here's a sample run of vmstat:
vmstat -x 10 10
The utility runs 10 times, reporting every 1 second. For example, we can see that out system has taken some swap, but it's not doing anything much with it, there's approx. 35MB free memory and there's very little I/O activity, as there are no blocked processes. The CPU utilization spikes from just a few percents to almost 90% before calming down.
Nothing specially exciting, but in critical situations, this kind of information can be critical.
7. Combine the power of iostat and vmstat with dstat
dstat aims to replace vmstat, iostat and ifstat combined. It also offers exporting data into .csv files that can then be analyzed using spreadsheet software. dstat uses a pleasant color output in the terminal:
Plus you can make really nice graphs. The spike in the graph comes from opening the Firefox browser, for instance.
8. Collect, report or save system activity information with sar
sar is another powerful, versatile system. It is a sort of a jack o' all trades when it comes to monitoring and logging system activity. sar can be very useful for trying to analyze strange system problems where normal logs like boot.msg, messages or secure under /var/log do not yield too much information. sar writes the daily statistics into log files under /var/log/sa. Like we did before, we can monitor CPU utilization, every 2 seconds, 10 times:
sar -u 2 10
Or you may want to monitor disk activity (10 iterations, every 5 seconds):
sar -d 5 10
Now for some really cool stuff ...
9. Create UDP server-client - version 1
Here's something radical: create a small UDP server that listens on a port. Then configure a client to send information to the server. All this without root access!
Configure server with netcat
netcat is an incredibly powerful utility that can do just about anything with TCP or UDP connections. It can open connections, listen on ports, scan ports, and much more, all this with both IPv4 and IPv6.
In our example, we will use it to create a small UDP server on one of the non-service ports. This means we won't need root access to get it going.
netcat -l -u -p 42000
Here's what we did:
-l tells netcat to listen, -u tells it to use UDP, -p specifies the port (42000).
We can indeed verify with netstat:
netstat -tulpen | grep 42000
And we have an open port:
Configure client
Now we need to configure the client. The big question is how to tell our process to send data to a remote machine, to a UDP port? The answer is quite simple: open a file descriptor that points to the remote server. Here's the actual BASH script that we will use to test our connection:
The most interesting bit is the line that starts with exec.
exec 104<> /dev/udp/192.168.1.143/$1
We created a file descriptor 104 that points to our server. Now, it is possible that the file descriptor number 104 might already be in use, so you may want to check first with lsof or randomize the choice of the descriptor. Furthermore, if you have a name resolution mechanism in place, you can use a hostname instead of an IP. If you wanted to use a TCP connection, you would use /dev/tcp.
The choice of the port is defined by the $1 variable, passed as a command-line argument. You can hard code it - or make everything configurable by the user at runtime. The rest of the code is unimportant; we do something and then send information to our file descriptor, without really caring what it is. Again, we need no root access to do this.
Test connection
Now, we can see the server-client connection in action. Our server is a Ubuntu 8.10machine, while our client is a Fedora 11. We ran the script on the client:
And watch the command-line on the server:
To make it even more exciting, I've created a small Flash demo with Wink. You are welcome to play the file, if you're interested:
Cool, eh?
10. Configure UDP server-client - version 2
The limitation with the exercise above is that we do not control over some of the finer aspects of our connection. Furthermore, the connection is limited to a single end-point. If one client connects, others will be refused. To make things more exciting, we can improve our server. Instead of using netcat, we will write one of our own - in Perl.
Perl is a powerful programming language, very flexible, very neat. I must admin I have only recently began dabbling in it, so do not expect any miracles, but here's one way of creating a UDP server in Perl - there are tons of other implementations available, better, smarter, faster, and more elegant.
The code is very simple. First, let's take a look at the entire file and then examine sections of code. Here it is:
#!/usr/bin/perl
use IO::Socket;
$server = IO::Socket::INET->new(LocalPort => '50060',
Proto => "udp")
or die "Could not create UDP server on port
$server_port : $@n";
my $datagram;
my $MAXSIZE = 16384; #buffer size
while (my $data=$server->recv($datagram,$MAXSIZE))
{
print $datagram;
my $logdate=`date +"%m-%d-%H:%M:%S"`;
chomp($logdate);
my $filename="file.$logdate";
open(FD,">","$filename");
print FD $datagram;
close(FD);
}
close($server);
The code begins with the standard Perl declaration. If you want extra debugging, you can add the -w flag. If you want to use strict code, then you may also want to add use strict;declaration. I warmly recommend this.
The next important bit is this one:
use IO::Socket;
This one tells Perl to use the IO::Socket object interface. You can also use IO:Socket::INET specifically for domain sockets. For more information, please check the official Perl documentation.
The next bit is the creation of the socket, i.e. server:
$server = IO::Socket::INET->new(LocalPort => '50060',
Proto => "udp")
or die "Could not create UDP server on port
$server_port : $@n";
We are trying to open the local UDP port 50060. If this cannot be done, the script will die with a rather descriptive message.
Next, we define a variable that will take incoming data (datagram) and the buffer size. The buffer size might be limited by the network implementation or network restrictions on your router/switch or the kernel itself, so some values might not work for you.
And then, we have the server doing some hard work. It prints the data to the screen. But it also creates a log file with a time stamp and prints the data to the file as well.
The beauty of this implementation is that the server permits multiple incoming connections. Of course, you will have to decide how you want to differentiate the data sent by different clients, whether by a message header or using additional IO:Socket:INET objects like PeerAddr.
On the client side, nothing changes.
Conclusion
That's it for now. This crazy collection should help you impress friends evoke a smile with your peers or even your boss and help you be more detailed and productive when it comes to system administration tasks. Some of the utilities and tricks presented here are tremendously useful.
If you're wondering what distribution you may need to be running to get these things done, don't worry. You can get them working on all distros. Throughout this document, I demonstrated using Ubuntu 8.10, Ubuntu 9.04 and Fedora 11. Debian-based or RedHat-based, there's something for everyone.


